Experience Studio
Dashboard
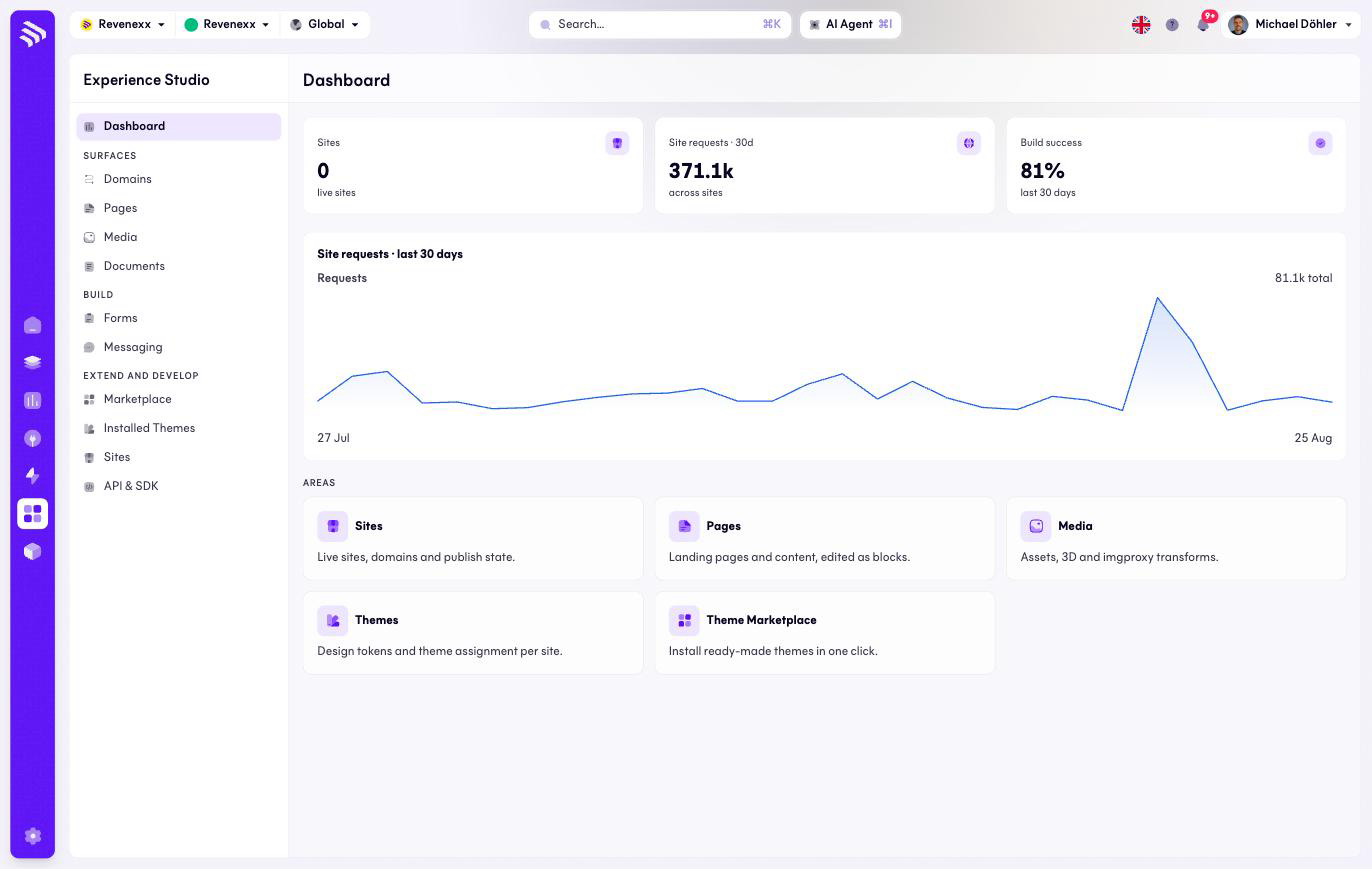
The Experience Studio entry screen: traffic, build health and shortcuts into every area.
The first screen of Experience Studio. It answers two questions before you open anything else: is traffic normal, and did the last builds go through?
Where you find it
Experience Studio › Dashboard — /experience/dashboard.
What it does
Three KPI cards, a traffic chart and a card grid that jumps into each area of the Studio. Nothing on this screen is editable — it reads, the other screens write.
Fields and controls
| Element | What it shows |
|---|---|
| Sites | The number of live sites. |
| Site requests · 30d | Requests across all sites in the last 30 days. |
| Build success | The share of successful site builds in the last 30 days. |
| Site requests · last 30 days | The same traffic as a line chart. |
| Areas | Cards for Sites, Pages, Media, Themes and Theme Marketplace. Each card opens its screen. |
The Sites KPI can disagree with the Sites list —
a tenant with six sites in status Ready showed "0 live sites" here. The
counter follows its own definition of live; the Sites list is the reliable
place to check what is actually deployed.
What happens when you change it
Nothing changes from here. The area cards and the KPI cards navigate; the screens they open do the editing.
Permissions
Not verified — the sites platform does not publish an app manifest the way the catalog apps do.