Integration Studio
Dashboard
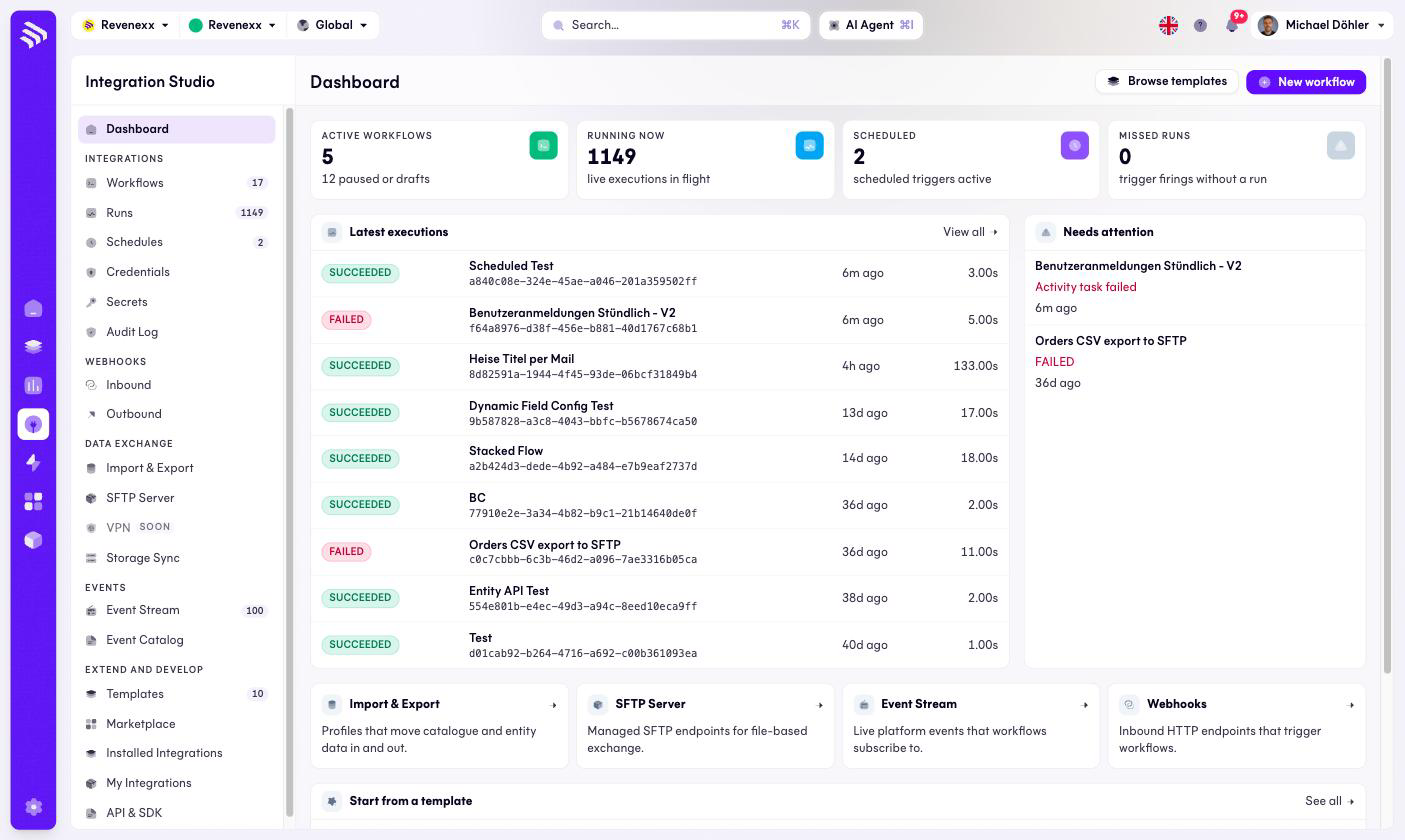
The Integration Studio entry screen: workflow KPIs, recent failures and the latest executions.
The first screen of Integration Studio, and the one worth checking each morning: are the workflows running, and did anything fail overnight?
Where you find it
Integration Studio › Dashboard — /integrations.
What it does
Four KPI cards, a Needs attention panel with recent failures, a list of the latest executions, area cards into Import & Export, SFTP Server, Event Stream and Webhooks, and a template strip. New workflow and Browse templates start new work from here.
Fields and controls
| Element | What it shows |
|---|---|
| Active workflows | Workflows in status Active, with the paused and draft count beside it. |
| Running now | Executions in flight. |
| Scheduled | How many scheduled triggers are active. |
| Missed runs | Scheduled runs that did not fire. Anything above 0 deserves a look. |
| Needs attention | Recent failed runs, each with workflow name and error summary. |
| Latest executions | Status badge, workflow name with run ID, age and duration per run. View all opens Runs. |
The Running now figure can match the total run count in the sidebar
rather than the number of executions actually in flight — the tenant in the
screenshot shows 1,149 for both. Treat Runs
as the reliable view of what is executing.
What happens when you change it
The dashboard itself changes nothing. New workflow opens the editor, Browse templates opens Templates, and the failure entries link into the runs they report.
Permissions
Not verified.
Related
- Workflows
- Runs
- Guide: Monitor syncs